State-Wise Per Capita Income in India (2025): A Snapshot of Economic Diversity
India, the world’s most populous nation, is a mosaic of economic contrasts. From the snow-capped peaks of Sikkim to the coastal charm of Goa, each state and union territory tells a unique story of prosperity and progress. The latest figures from PIB, NITI Aayog, and the Ministry of Statistics & Programme Implementation reveal striking disparities in per capita income across the country.
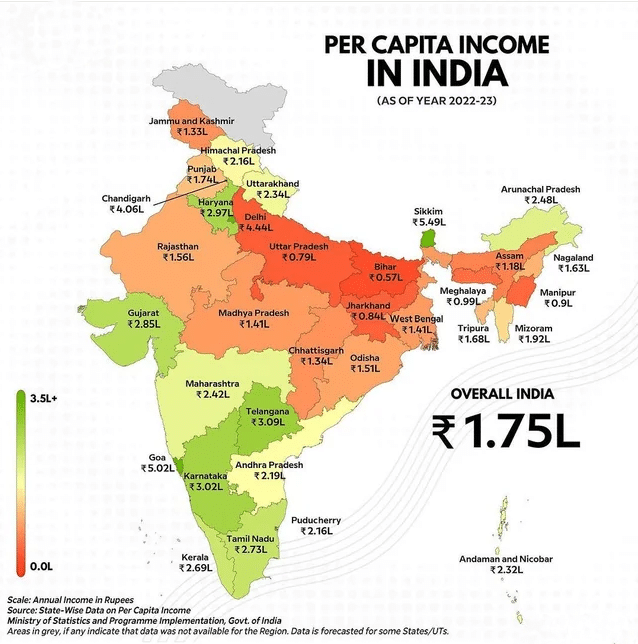
💰 Top 10 States/UTs by Per Capita Income (2023–24)
| Rank | State/UT | Per Capita Income (₹) |
|---|---|---|
| 1 | Sikkim | ₹587,743 |
| 2 | Goa | ₹492,648 |
| 3 | Delhi | ₹461,910 |
| 4 | Chandigarh | ₹399,654 |
| 5 | Telangana | ₹356,564 |
| 6 | Karnataka | ₹332,926 |
| 7 | Haryana | ₹325,759 |
| 8 | Tamil Nadu | ₹315,220 |
| 9 | Gujarat | ₹297,722 |
| 10 | Kerala | ₹281,001 |
📊 These figures reflect the Net State Domestic Product (NSDP) at current prices, a key indicator of economic health and individual prosperity2.
🚨 States with the Lowest Per Capita Income
| Rank | State | Per Capita Income (₹) |
|---|---|---|
| 33 | Bihar | ₹68,828 |
| 32 | Uttar Pradesh | ₹104,126 |
| 31 | Jharkhand | ₹115,960 |
Despite national growth, these states continue to face challenges in infrastructure, education, and industrial development.
🌐 Why It Matters
Per capita income is more than just a number—it’s a reflection of the standard of living, access to opportunities, and the economic well-being of citizens. Policymakers use this data to allocate resources, design welfare programs, and track development goals.